8.2. Create New Report
Report generation options are dynamic i.e. all reports include some widgets. Creating the report is a two step process:
1 Create the report template. 2 Add and manage the widgets in the template.
8.2.1. Create a Template
Create a new template by clicking on + Icon. You need to add the Report Name, Report category and the description.
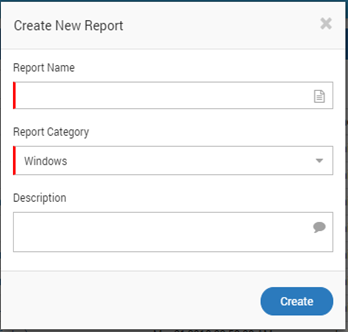
Create New Report
If the category is not available in the drop down, then simply type the name of the category. A new category will be automatically created when you click on the Create button. The template will appear as the blank template under the defined category.
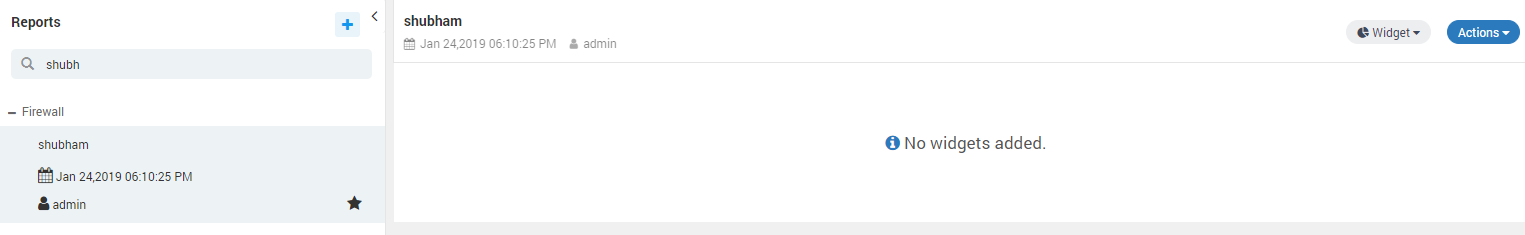
Blank Template
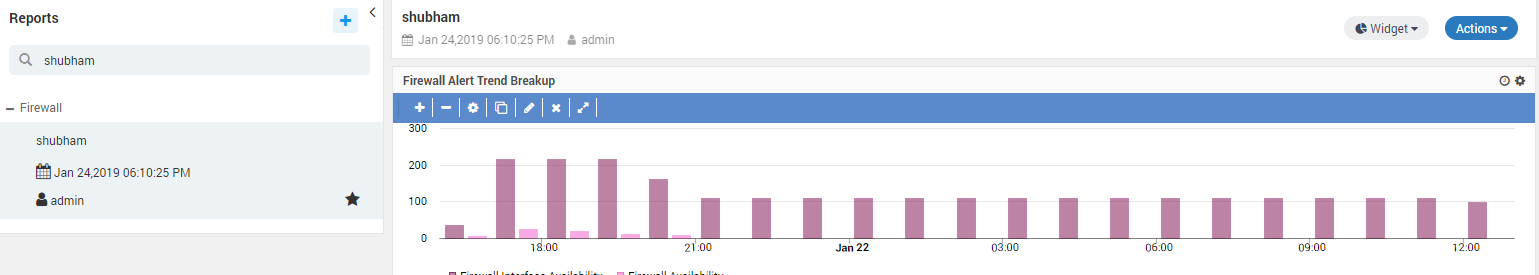
Once you have created a report, you need to add required widgets to the report’s dashboard.
8.2.2. Add Widgets in reports
Select Existing Widget
- Search for the report and the widget you want to clone into your report
- Click on the icon and then on icon. A popup will appear.
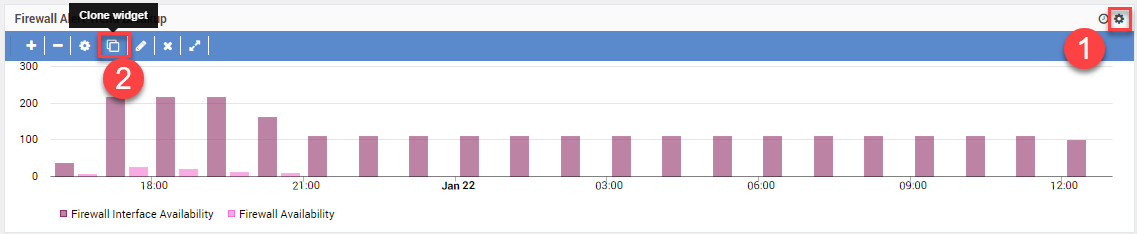
Clone Button in Widget
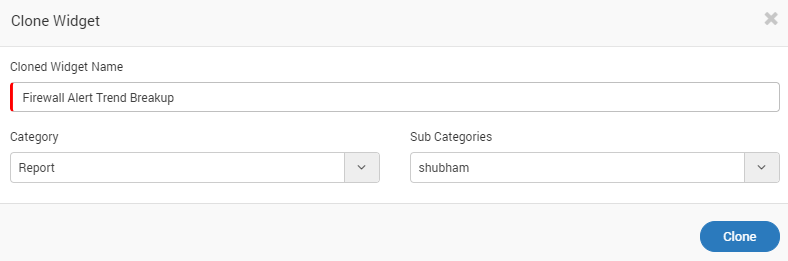
Popup for Clone Widget Settings
- Change the name if you want.
- In Category, select ‘Report’.
- In Sub Categories, select your report.
- Click ‘Clone’. The widget will appear in your report.
Widget Created by Cloning
Create a New Widget
You can create a new widget or select from existing widget. The widget can be from following types:
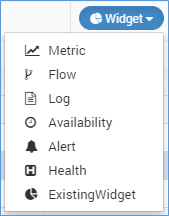
Report Widgets
Metric: The following types of views are available for Metric:
- Gauge
- Historical
- Top N/Least N
- Grid
- Metric
Flow: The following types of views are available for Metric:
- Gauge
- Historical
- Top N/Least N
- Grid
- Tree Map
- Chord
- Map
- Chart
Log: The following types of views are available for Metric:
- Gauge
- Historical
- Top N/Least N
- Grid
- Tree Map
- Chord
- Map
- Log
Availability: The following types of views are available for Metric:
- Gauge
- Historical
- Top N/Least N
- Grid
- Heat Map
Alert: The following types of views are available for Metric:
- Gauge
- Historical
- Top N/Least N
- Grid
- Heat Map
- Chart
- Map
Health: Only Gauge is available.
8.2.3. Example: Availability Report
You can create an availability report for the monitors to see the trend of their availability. This report has following features:
- Custom Time Range: You can manage the time range of the report data in real time.
- Graphical Presentation: You can create the graphical representation of data to quickly compare availability of different monitors.
- Availability Trend: You can change the graph types (visualizations) in real time for analysis.
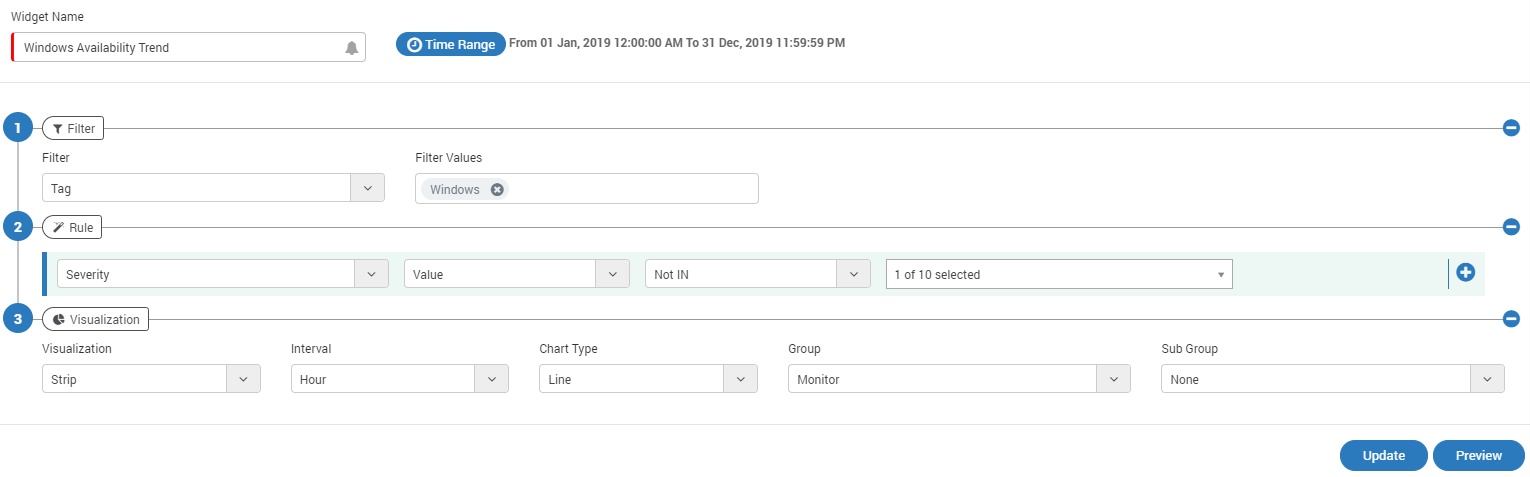
Create Availability Widget
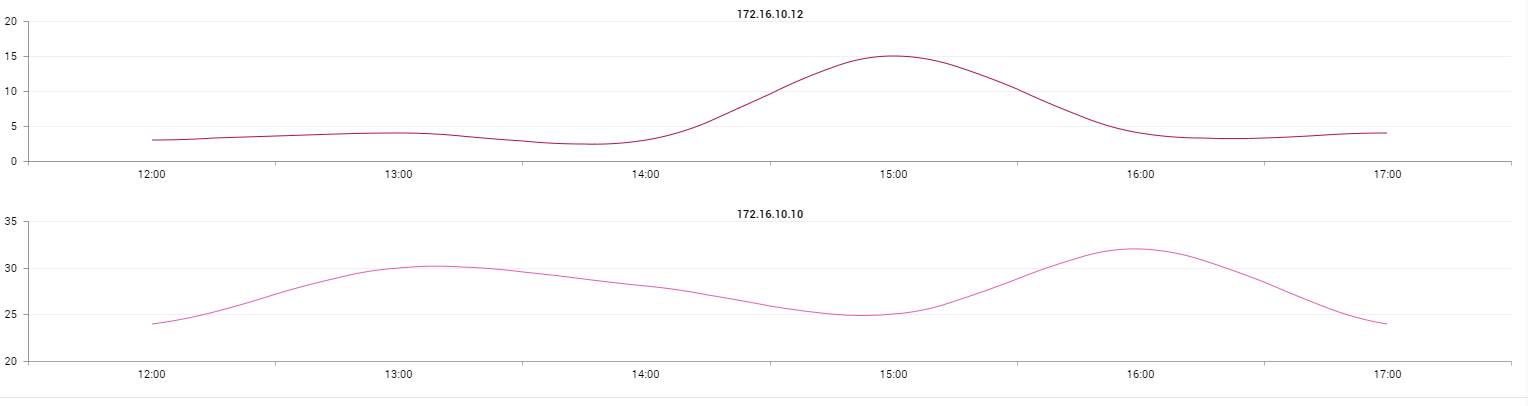
Availability Widget Example